Graphical abstract
The journal Polimery w Medycynie – Polymers in Medicine requires graphical abstracts (GAs) for papers accepted for publication. The editorial office of Polim Med does not offer graphic designing or DTP services – the authors have to provide graphical abstracts in a finished form. The GAs should be submitted as a separate file in the submission system.
A GA is a single, concise, pictorial and visual summary of the main findings of the article; a visual representation of the key messages of a research paper, which captures the content of the article for readers at a single glance. It can be compared a GA to a film trailer – it outlines the key points in 2–3 minutes of reading and entices the reader to read the whole paper.
It should be a figure specially designed for the purpose (and not a compilation of figures and tables from the paper).
TIPS HOW TO PREPARE A GA
1) A GA cannot exceed the size on one A4 page – it should be less complicated than, e.g., conference poster.
2) A graphical abstract has to be read horizontally or circularly and have a rectangular, square or round shape. It cannot be a single column read from top to bottom. For ease of browsing, the graphical abstract should have a clear start and end, preferably "reading" from top to bottom or left to right.
3) Start by identifying the main message of the study. This serves as the focus of the GA, providing further guidance in determining the design and content of the illustration. Concentrate on 1 or 2 key points on average (not more than 3).
4) A GA should be comprehensible without the context of the text (self-explanatory) – it should enable the readers to decide whether the text is worthy their attention by making clear what the paper is about, not by providing a riddle. Therefore, a GA should include the title of the paper – its contents can be such riddle without it. The very nature of a visual abstract demands that it be succinct, hence it can be prone to oversimplification. Because it does not include specific details of a study, the results presented may be at risk for misinterpretation.11
5) A GA should clearly state the question or purpose of the study (to contextualize it) and describe the research design (e.g., randomized trial, retrospective review, meta-analysis) to make the quality of evidence clearer.21 If you are confused how your GA should look like, refer to GAs for already published papers with similar designs to those of your study.1
6) Choose the graphical material wisely – since the space on your disposal is limited, each picture, chart or table should have informative, not only decorative value. A GA cannot exceed the size of 1 A4 page – it should be less complicated than, e.g., conference poster.
7) A GA has to have a clear structure, albeit it does not have to reflect the structure of the plain text abstract or the whole paper. If it proves impossible to present material and methods, results and conclusions, it can provide a more general overview of the paper. It can to be read horizontally (from the left to the right), vertically (from top to bottom), or circularly, can have a radial arrangement or employ a more eccentric design; it have a rectangular, square or round shape – but it has to have a clear beginning and end. It cannot be a single column read from top to bottom – such format will not be useful for a screen display.
8) Regarding text within a GA, sans serif typefaces are considered a better choice (mainly for aesthetic reasons). Use text sparingly, but if you feel that conclusions should be provided as full sentences or they will be unclear – use full sentences in a separate box/section. Lower text density can make your GA more easily readable, which can translate into higher engagement.
9) Effective use of color can enhance a GA both aesthetically and by directing the readers’ attention to focal points of interest.67 Use colors consciously – e.g., to discern different parts of a GA or to highlight key issues. More than 3 colors in one GA can be confusing.68 Negative space (congaing neither graphical material nor text) is also important as a “resting spot” for the eyes of the reader.65 Some journals (e.g., Allergy) stipulate the use of predetermined color palettes for GAs.
WHAT TO AVOID
1) Neither one of the figures from the paper nor the PRISMA flowchart cannot at the same time serve as a GA.
2) A GA should not contain tables, figures taken directly from the paper or whole paragraphs of text, as well as it cannot be compiled from tables and figures from the manuscript.
3) A GA cannot contain only a table or plain text in the form of highlights.
4) A GA cannot consist only of graphical material (figures, charts, graphs) which were not used in the paper, but their meaning is unclear out of the context of the whole paper and the GA contains no text commentary.
5) Stark color contrast between the letters and the background (e.g., red letters against green background) makes the text – even very short – virtually illegible.
6) Presenting numerical data (like p-values) whose meaning is unclear outside the context of the whole paper has no sense in a GA.
7) Do not use abbreviations which can be unclear without reading the text (obvious acronyms, like DNA, are of course a good choice).
8) No additional text, outline or synopsis should be included. Please do not use a heading “graphical abstract” within the image file.
9) A GA must not include:
- reference showing how the paper should be cited;
- logotype of Wroclaw Medical University;
- title of the journal;
- cover of the journal.
TECHNICAL ISSUES
Allowed data formats: PDF, JPG, PNG, and TIF (min. 2400 pixels of the base in the drawing (width)). The minimal resolution of TIF, JPG and PNG files is 300 dpi. Regarding text within the graphical abstract, its size should be 12–16 points (smaller fonts will be illegible online).
A GA can be designed using various online, free or more professional software – e.g., PowerPoint, Mind The Graph, Google Slides, Google Draqing, Adobe Illustrator, and Affinity Designer
MORE ON HOW TO PREPARE A GA (WITH EXAMPLES AND ONLINE TOOLS)
1) https://www.elsevier.com/authors/tools-and-resources/visual-abstract
2) https://mindthegraph.com/blog/create-effective-graphical-abstract/
4) https://www.biorender.com/blog/top-4-tips-for-designing-a-graphical-abstract
6) https://www.annaclemens.com/blog/make-graphical-abstract-paper
7) https://learning.edanz.com/creating-graphical-abstracts/
8) https://www.futuremedicine.com/graphicalabstracts
Should any questions arise, do not hesitate to contact the editorial office. Please send the graphical abstracts via e-mail at the e-mail address marek.misiak@umw.edu.pl
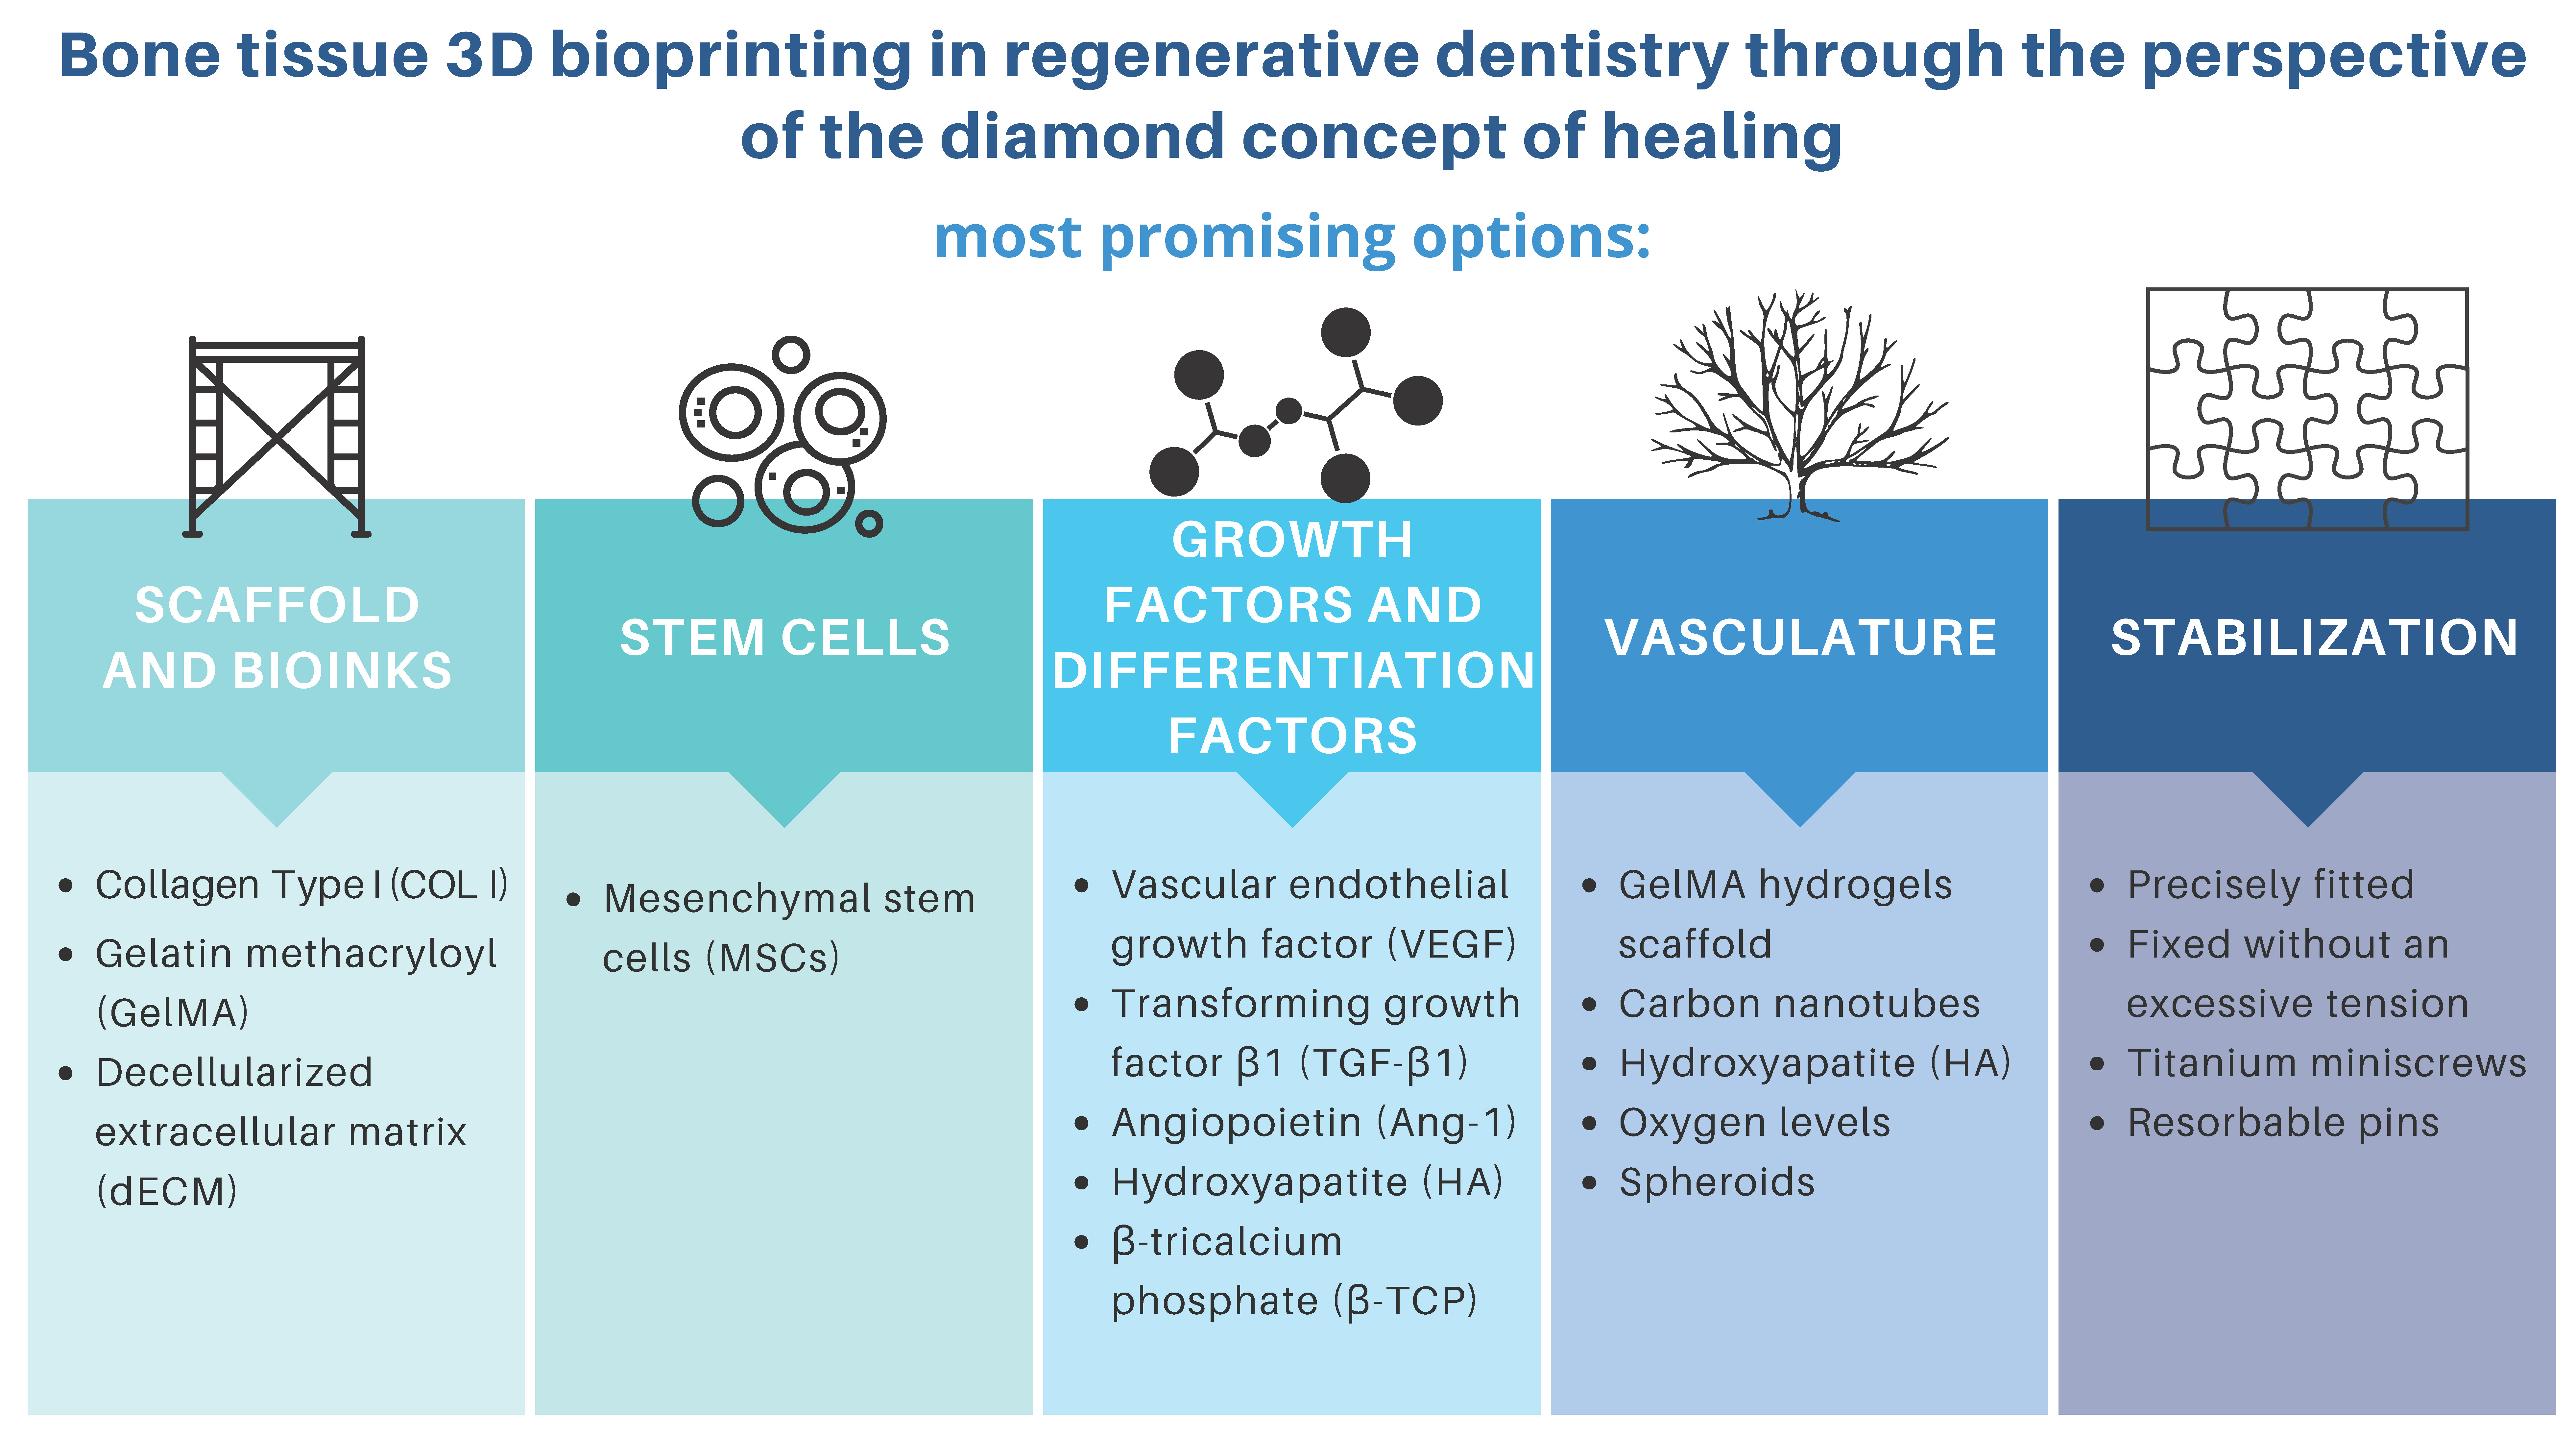
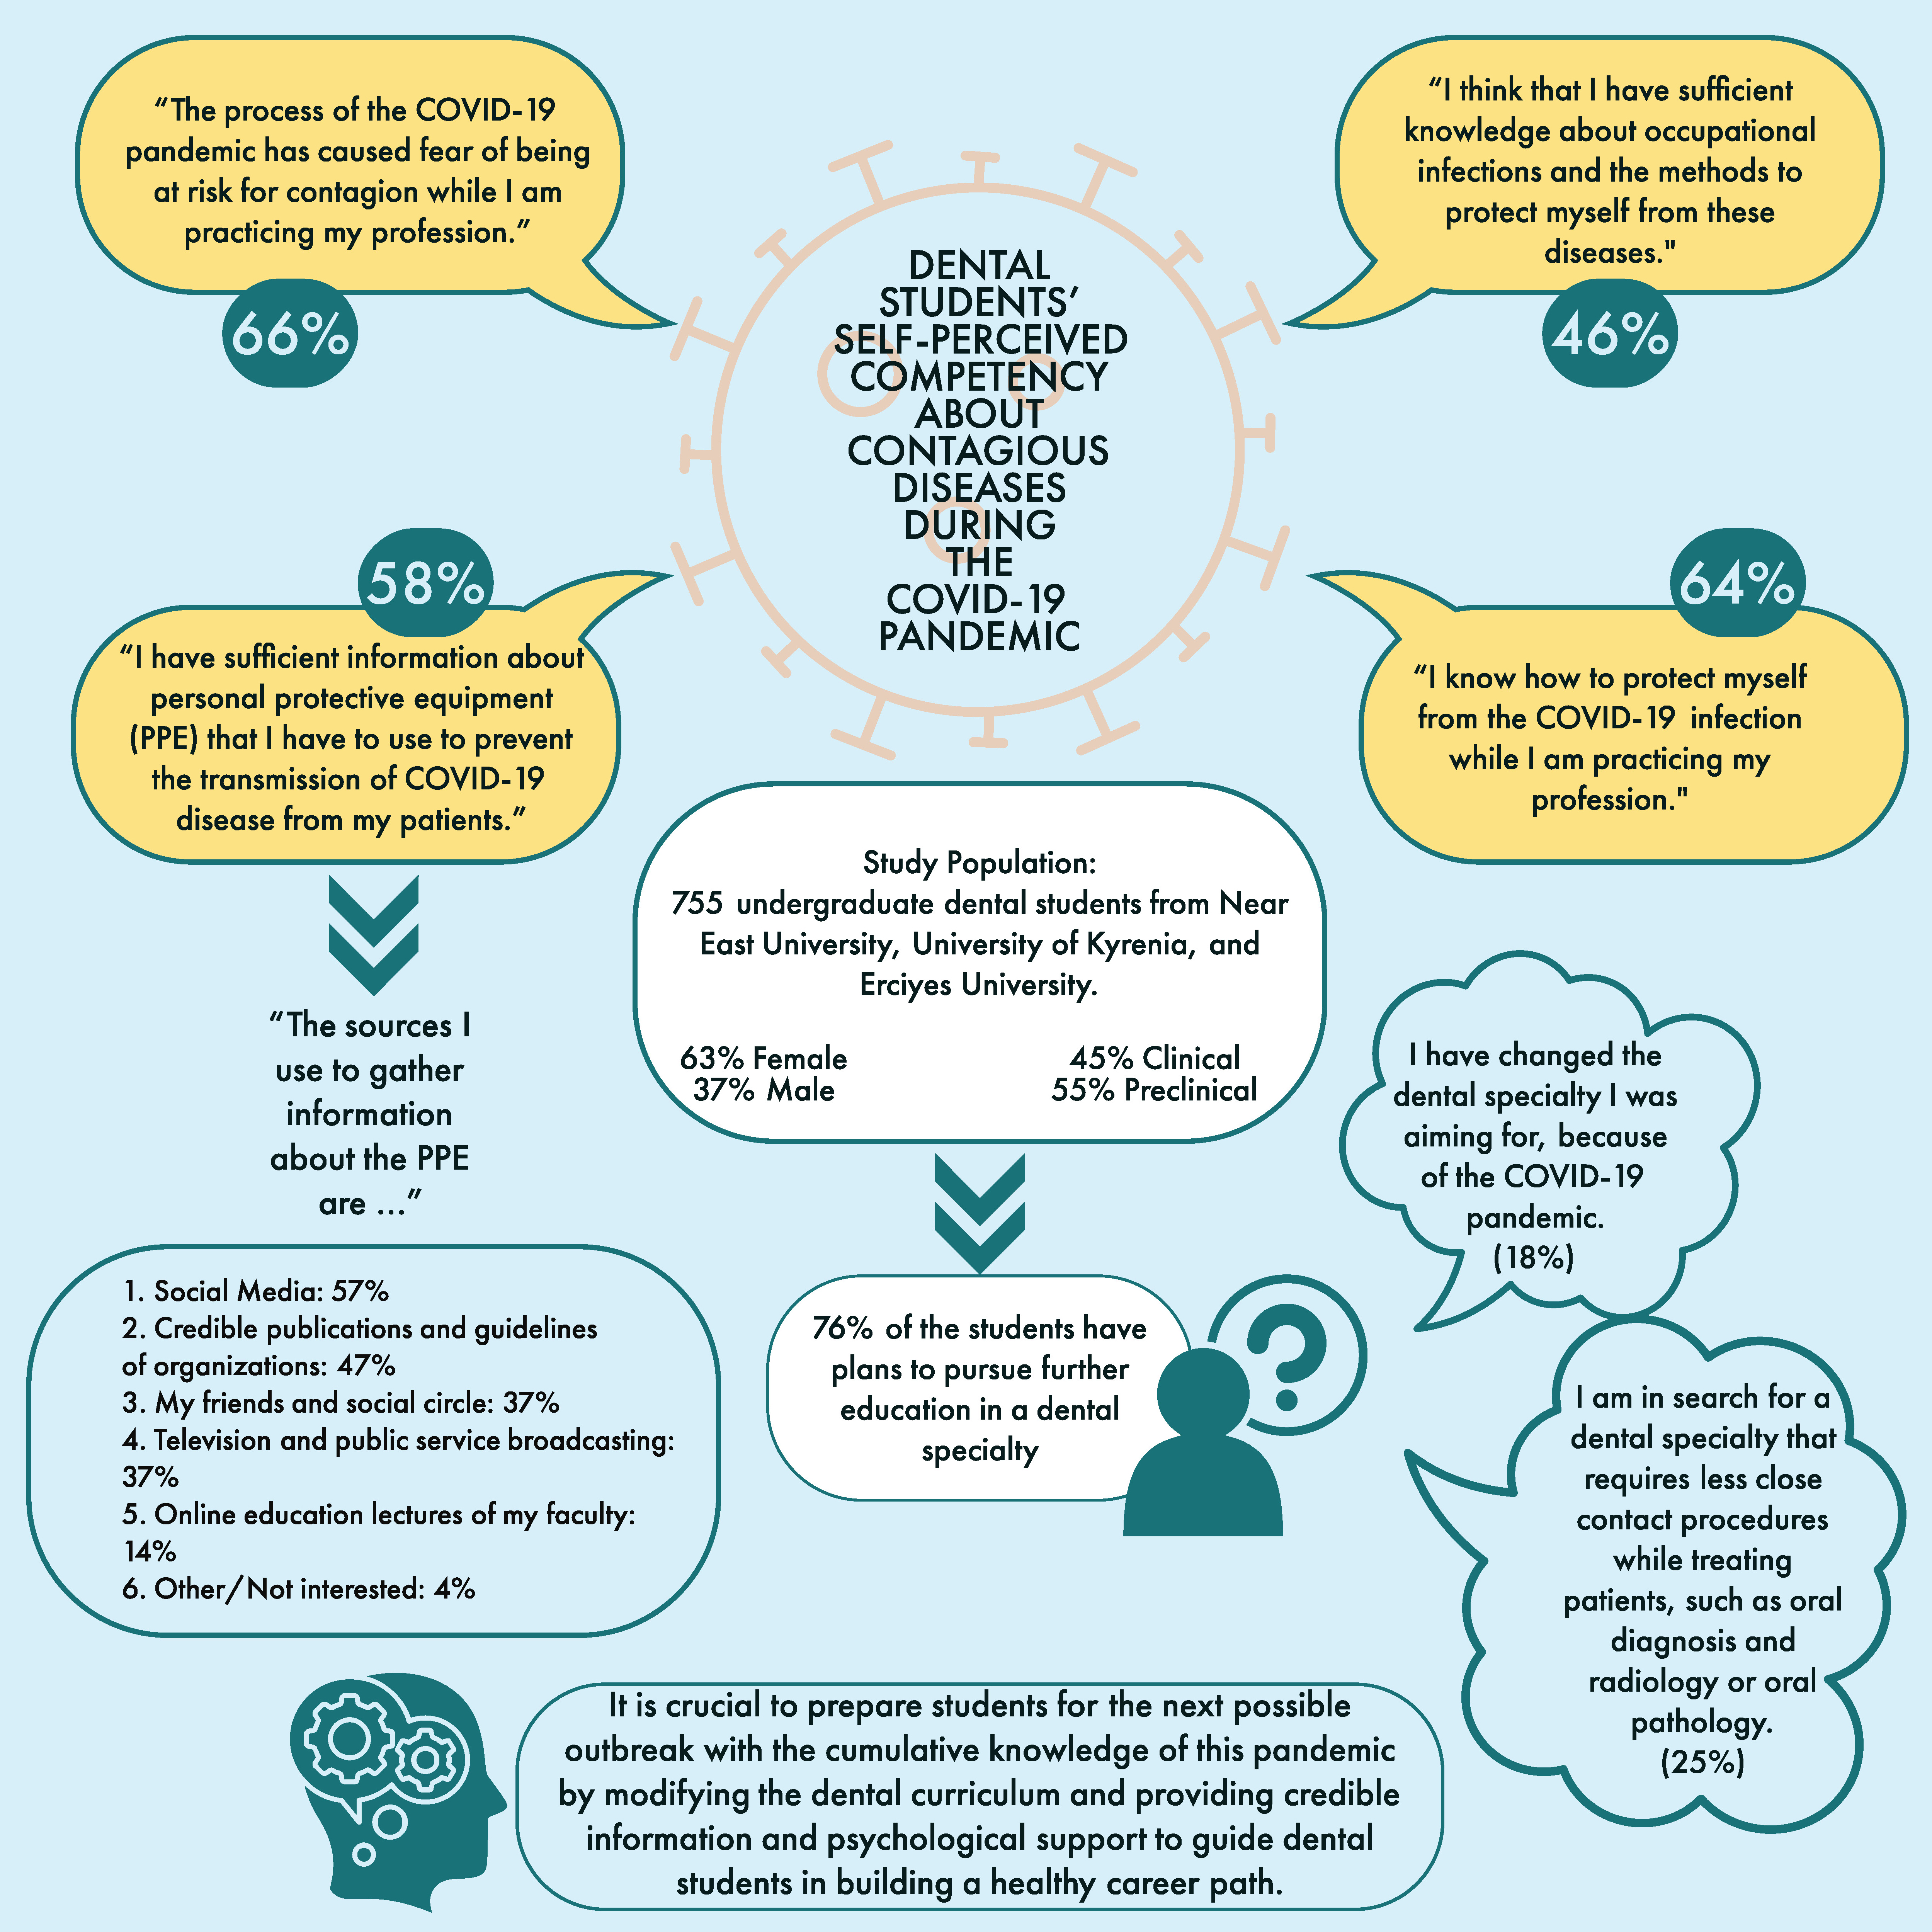
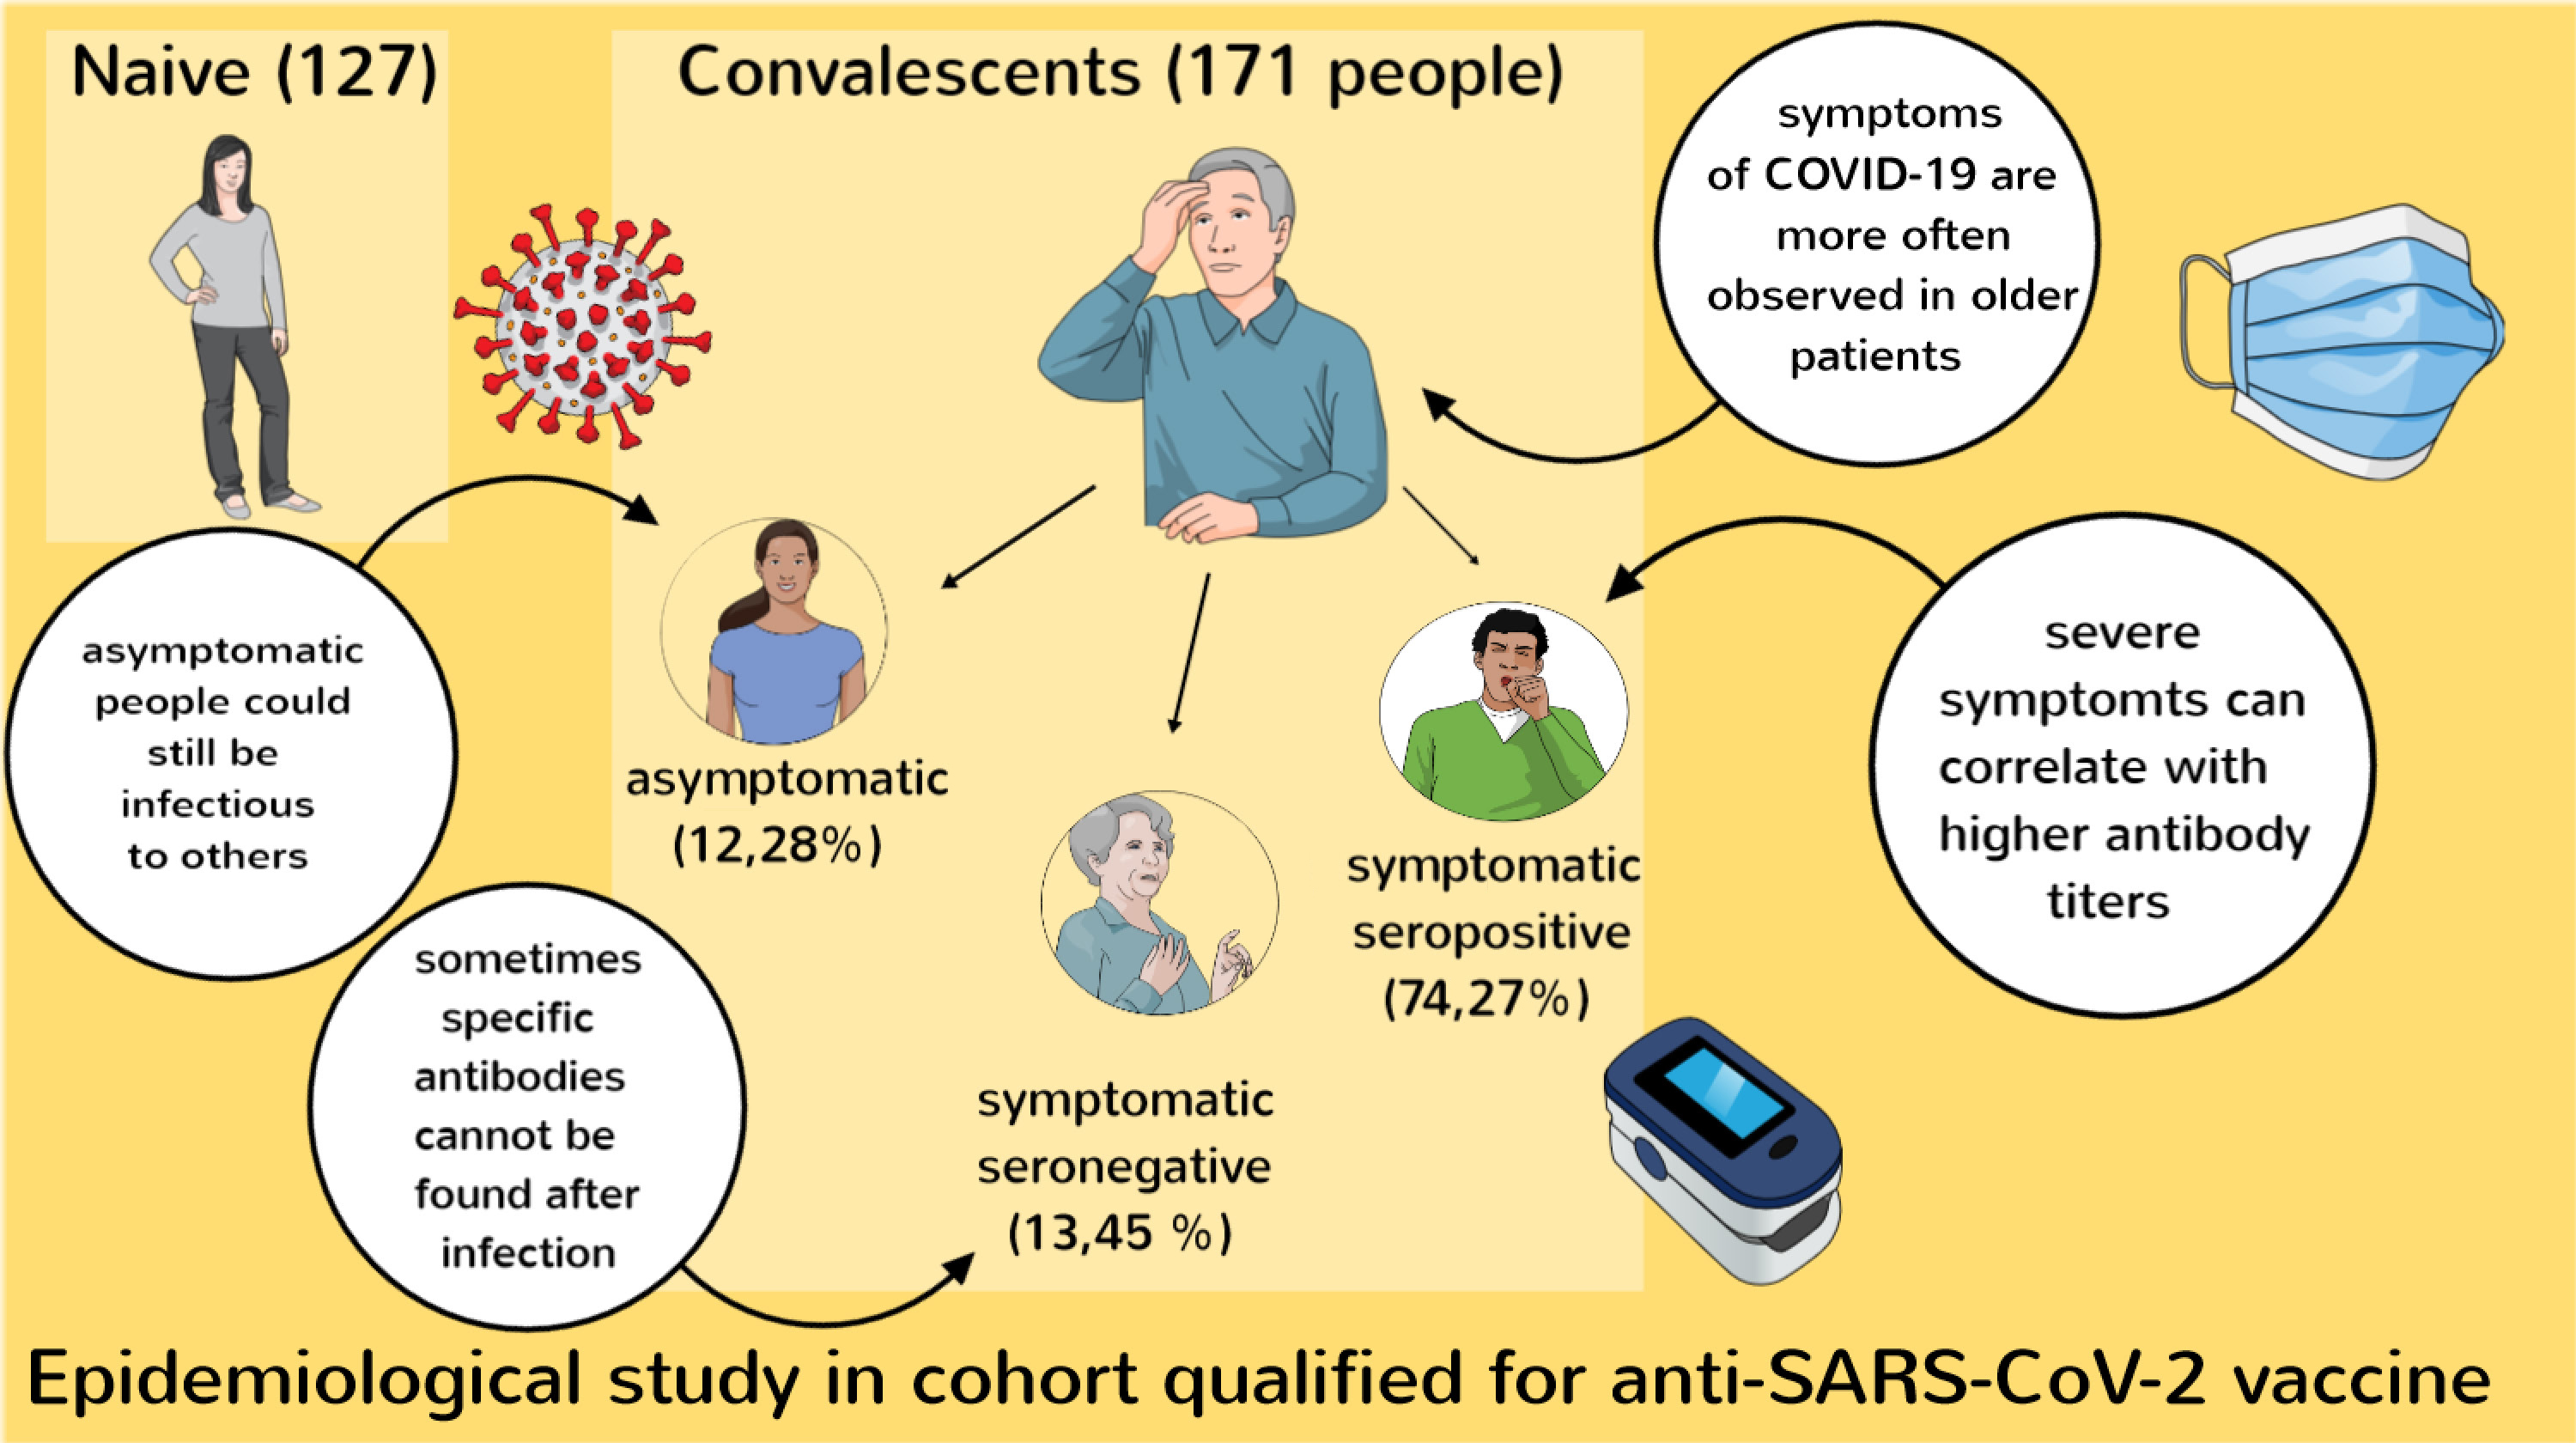
SOME INSPIRING GRAPHICAL ABSTRACTS